Next course begins April 22nd
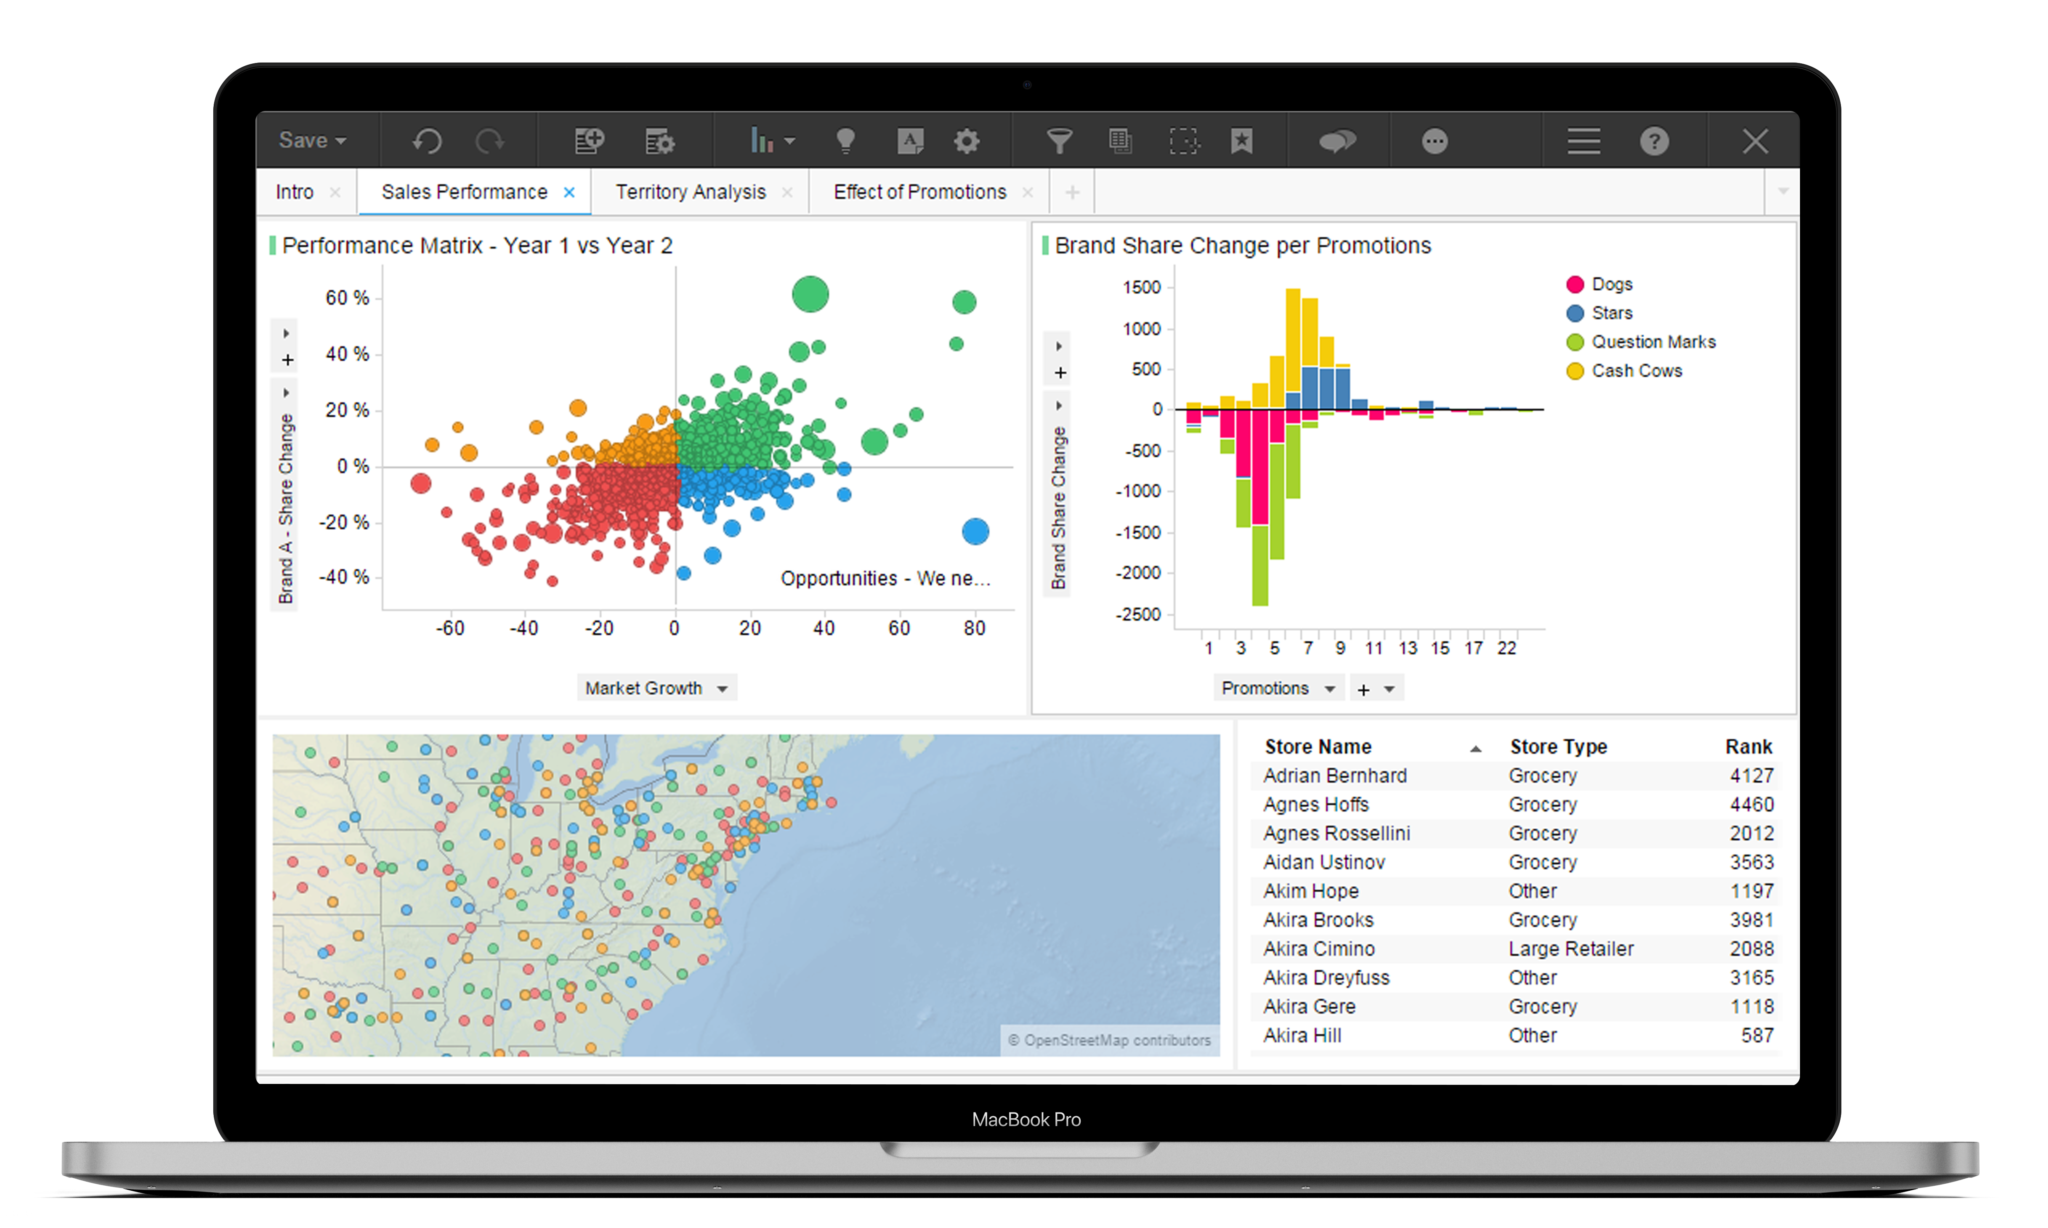
Tibco Spotfire Essentials
Our 4 day Tibco Spitfire Essentials course will provide you with a thorough understanding in Tibia Spitfire functionality and features. The hands on training course will help you gain skills in developing visualisations and dashboards, obtaining insights and managing data from various data sources. This course is ideal for beginners to Tibco Spotfire.